Filing Memory Bugs
This page describes the common set of steps for filing a memory bug.
- Grab platform-specific measurements.
- Grab a memory-infra trace.
- File a bug on crbug.com. Attach screenshots and traces from previous steps.
Windows
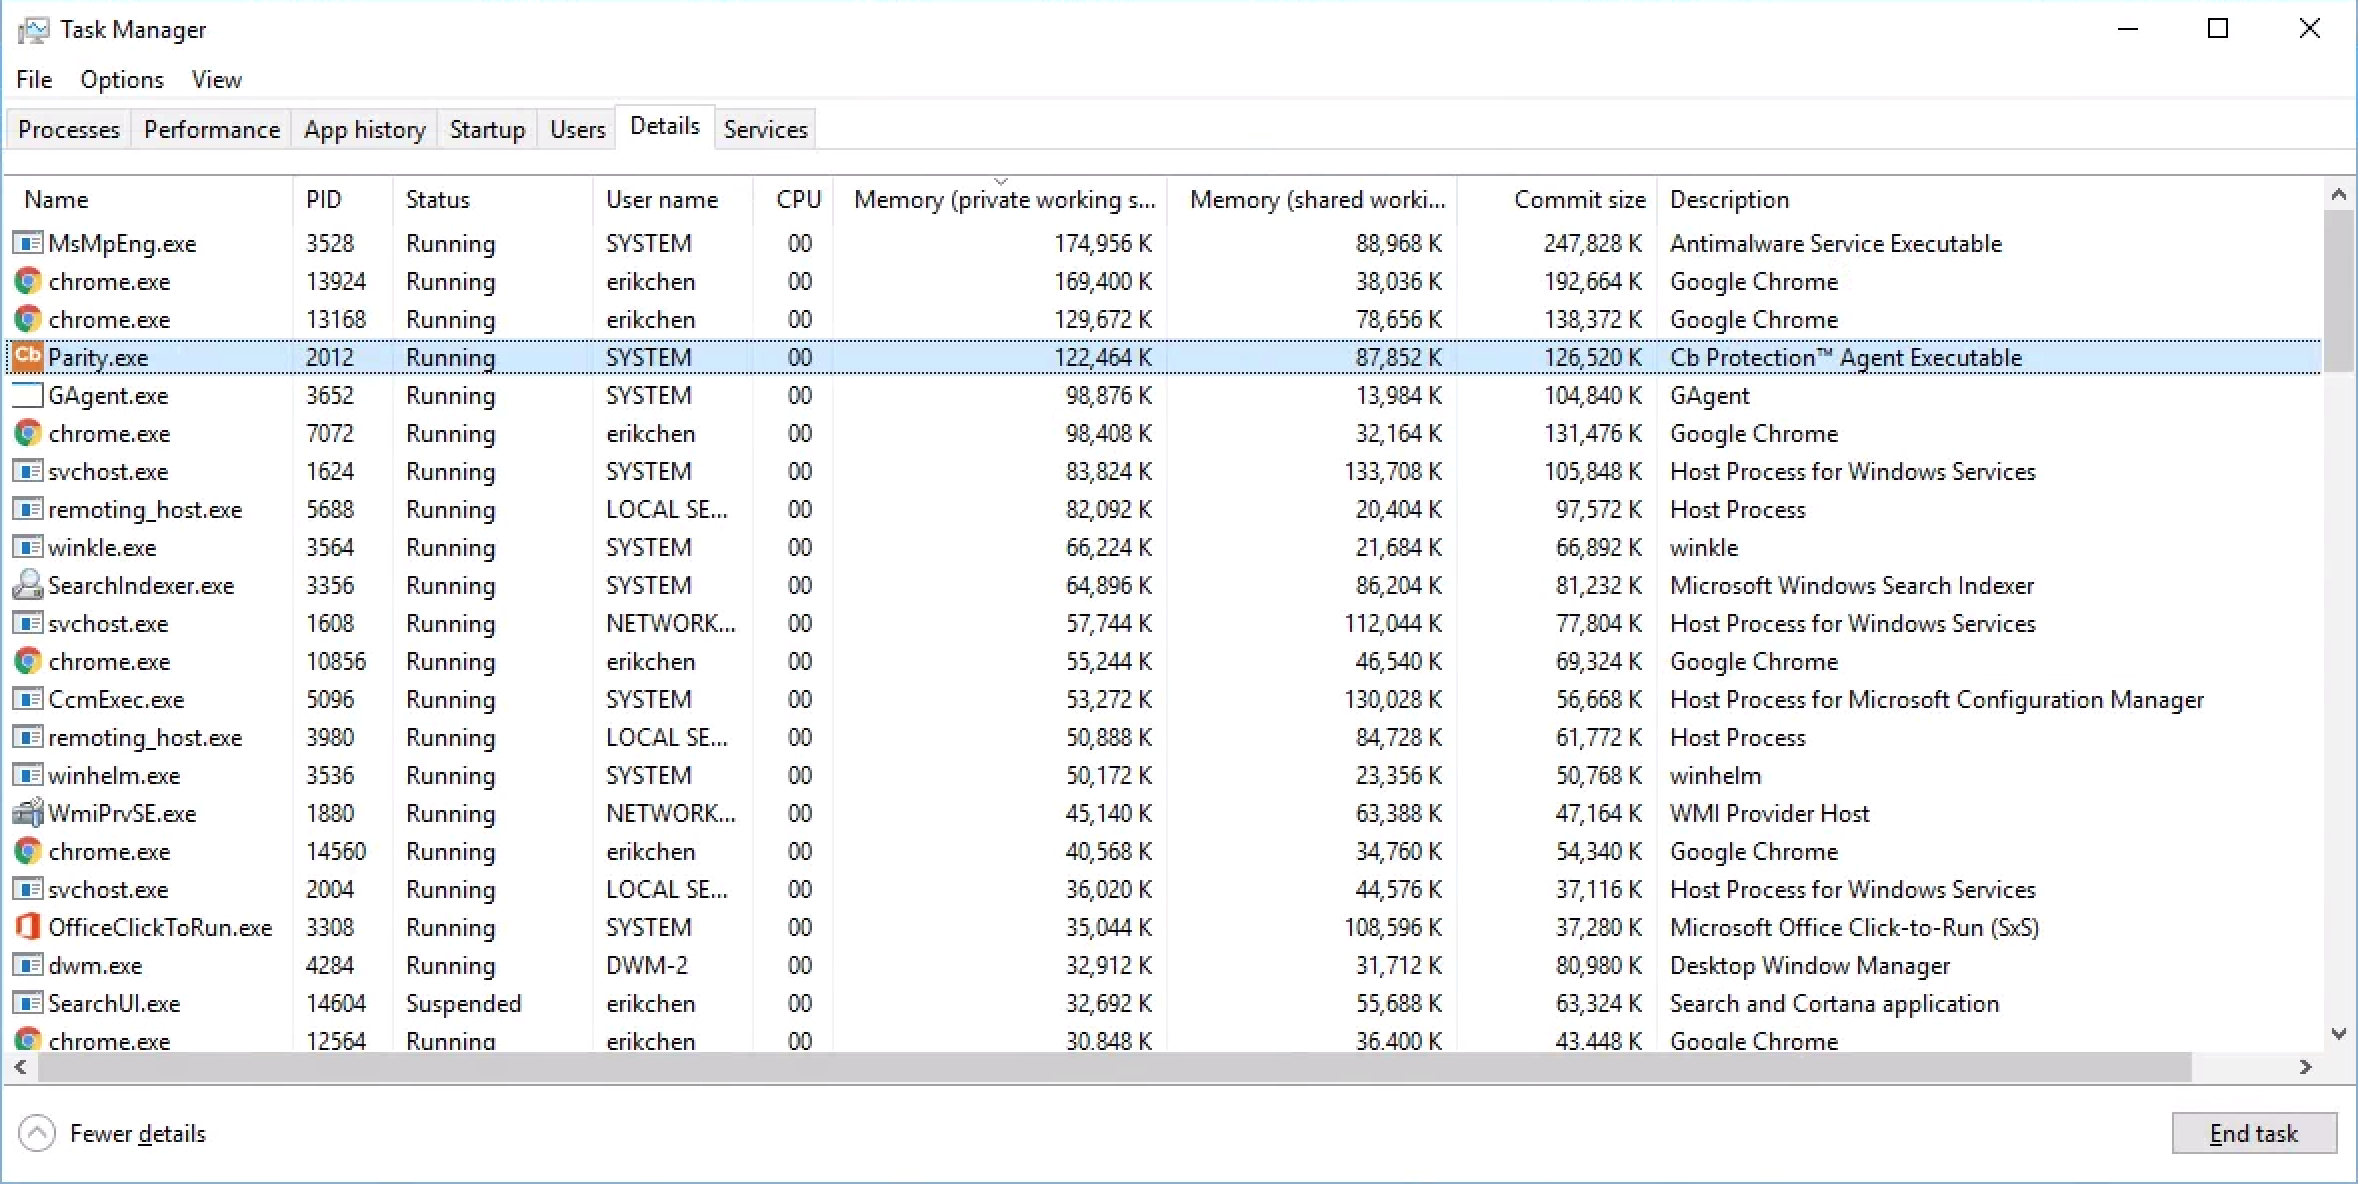
Task Manager
- Open Task Manager.
- Select the Details pane.
- Right click the first row with column names. Select Select Columns.
- Select Memory (private working set)
- Select Memory (shared working set)
- Select Commit size
- Sort processes with highest Memory (private working set) first by clicking once on the column name.
- Take a screenshot using Snipping Tool
macOS
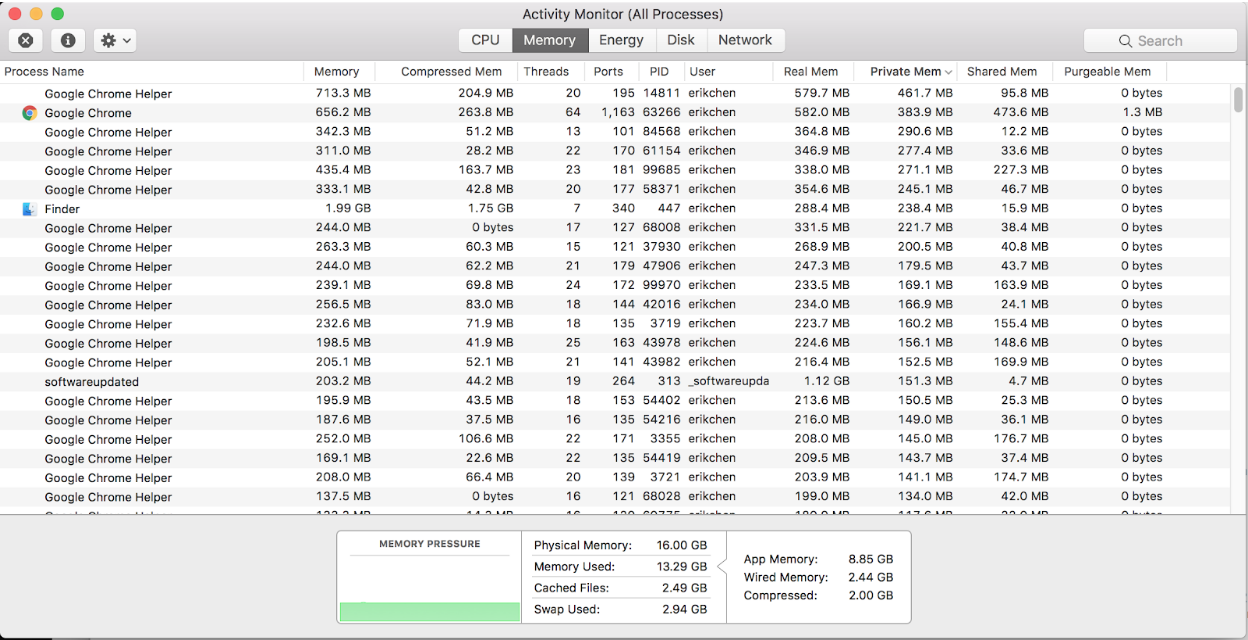
Step 1 - Activity Monitor
- Open Activity Monitor, Select the Memory Tab.
- Under the View Menu, select the Real Private Memory and Real Memory columns.
- Sort processes with highest Private Memory first by clicking once on Private Memory.
- Take a screenshot by pressing cmd + shift + 3.
- You can also use cmd + shift + 4 to manually select a region on the screen to save.
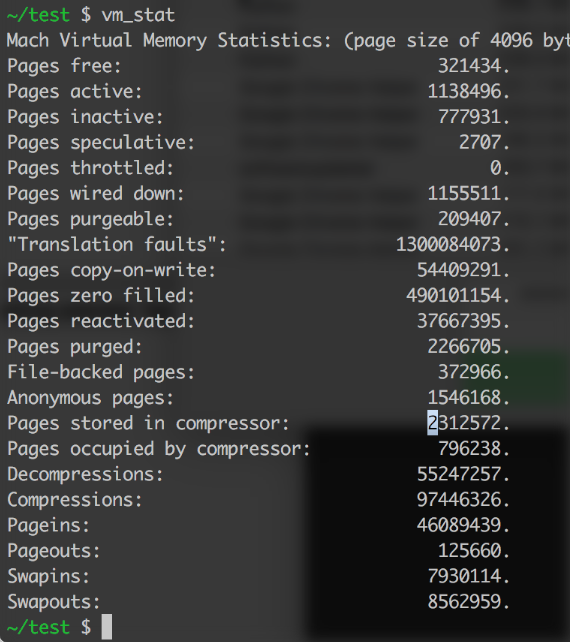
Step 2 - Terminal
- Open the Terminal application.
- Run the following command and report the results.
vm_stat
Linux
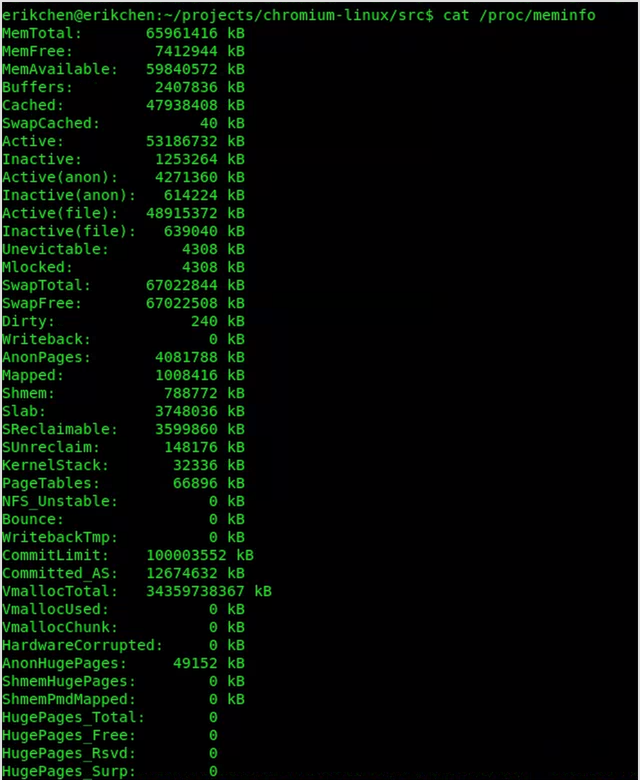
/proc/meminfo
- Open a shell.
- Run the command
cat /proc/meminfo - Record the results.
Memory-Infra Trace
- Open a new chrome tab and navigate to chrome://tracing
- Click Record in the top left corner.
- Click the button Manually select settings and click None under the left column to unselect everything.
- Under the right column, select memory-infra
- Click Record. Wait for five seconds. Then click stop.
- Click the Save button in the top left corner a pick a name for the trace.