Memory Benchmarks
This document describes benchmarks available to track Chrome‘s and WebView’s memory usage, where they live, what they measure, how to run them, and on how to diagnose regressions.
Glossary
- User story: a set of actions to perform on a browser or device (e.g. open google homepage, type “foo”, click search, scroll down, visit first result, etc.).
- Metric: a data aggregation process that takes a Chrome trace as input (produced by a Telemetry run) and produces a set of summary numbers as output (e.g. total GPU memory used).
- Benchmark: a combination of (one or more) user stories and (one or more) metrics.
System Health
System health is an effort to unify top-level benchmarks (as opposite to micro-benchmarks and regression tests) that are suitable to capture representative user stories.
Benchmarks
System health memory benchmarks are:
- system_health.memory_mobile - user stories running on Android devices.
- system_health.memory_desktop - user stories running on desktop platforms.
These benchmarks are run continuously on the chrome.perf waterfall, collecting and reporting results on the Chrome Performance Dashboard.
User stories
System health user stories are classified by the kind of interactions they perform with the browser:
browsestories navigate to a URL and interact with the page; e.g. scroll, click on elements, navigate to subpages, navigate back.loadstories just navigate to a URL and wait for the page to load.backgroundstories navigate to a URL, possibly interact with the page, and then bring another app to the foreground (thus pushing the browser to the background).long_runningstories interact with a page for a longer period of time (~5 mins).multitabloads different web sites in several tabs, then cycles through them.playloads a web site and plays some media (e.g. a song).
The full name of a story has the form {interaction}:{category}:{site}[:{year}] where:
interactionis one the labels given above;categoryis used to group together sites with a similar purpose, e.g.news,social,tools;siteis a short name identifying the website in which the story mostly takes place, e.g.cnn,facebook,gmail.yearindicates the year in which the web page recording for the story was most recently updated.
For example browse:news:cnn:2018 and background:social:facebook are two system health user stories. The list of all current stories can be found at bit.ly/csh-stories.
Today, for most stories, a garbage collection is forced at the end of the story and a memory dump is then triggered. Metrics report the values obtained from this single measurement.
Continuous monitoring
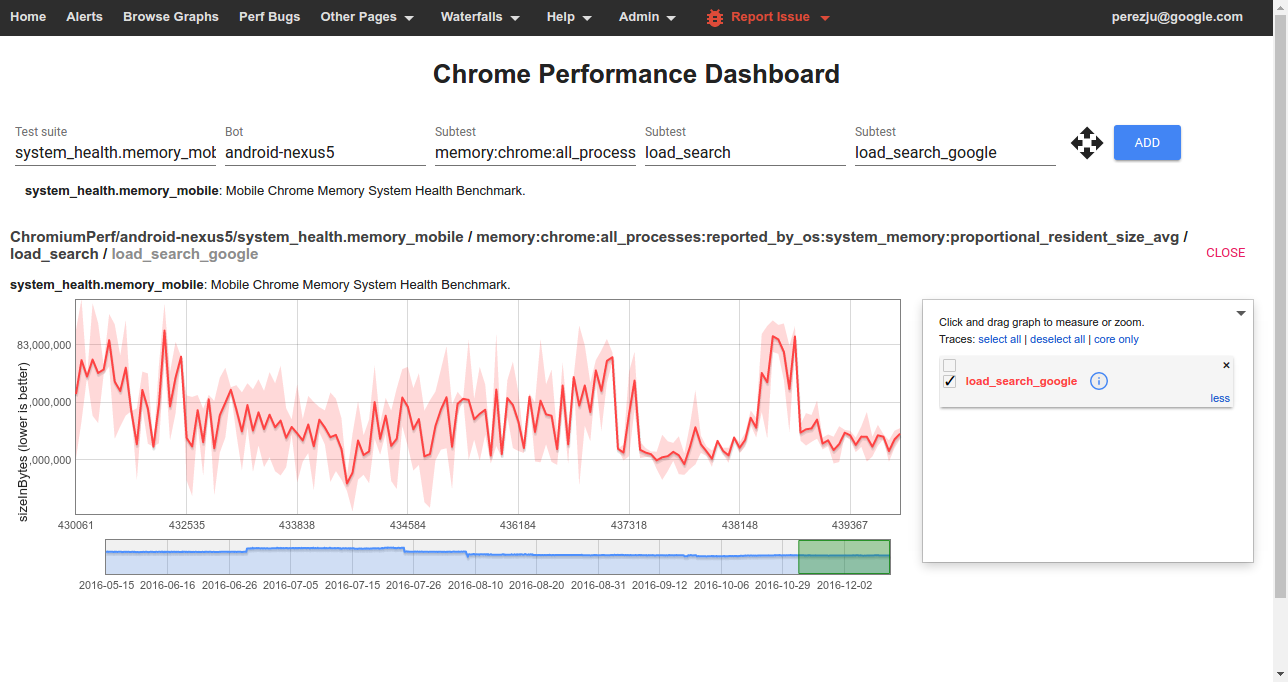
To view data from one of the benchmarks on the Chrome Performance Dashboard you should select:
- Test suite: The name of a benchmark.
- Bot: The name of a platform or device configuration. Sign in to also see internal bots.
- Subtest (1): The name of a metric.
- Subtest (2): The name of a story group; these have the form
{interaction}_{category}for system health stories. - Subtest (3): The name of a user story (with
:replaced by_).
Clicking on any point of the graph will give you the commit range, links to the builder that ran the benchmark, and a trace file collected during the story run. See below for details on how to interpret these traces when debugging memory related issues.
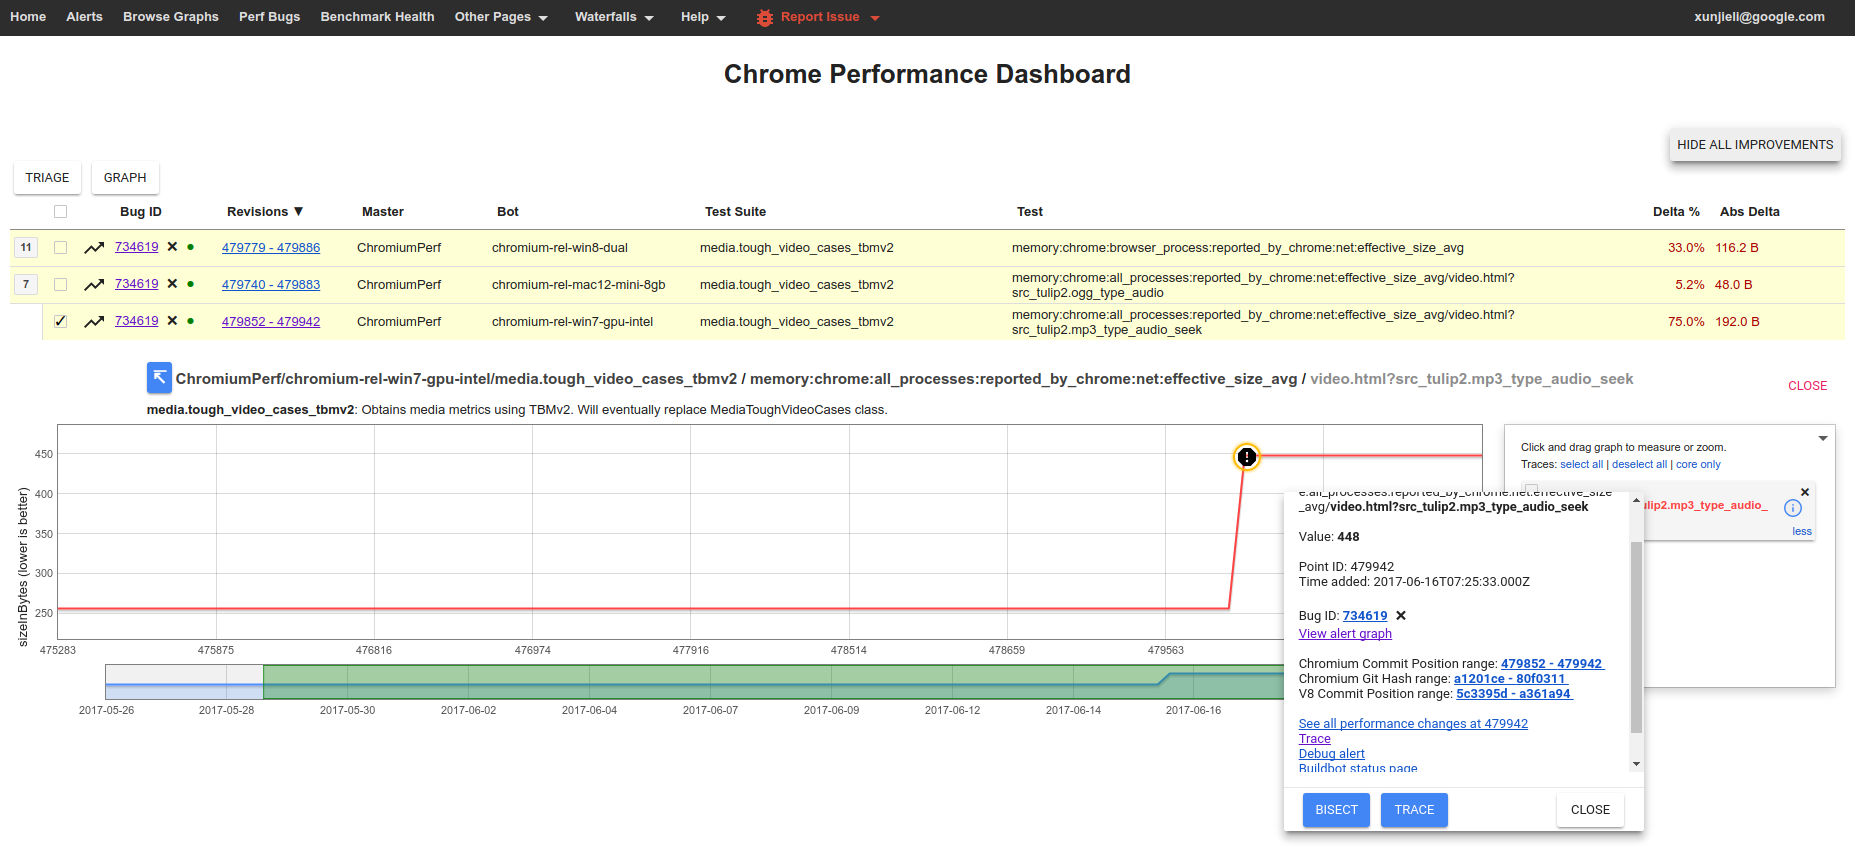
Many of the high level memory measurements are automatically tracked and the Performance Dashboard will generate alerts when a memory regression is detected. These are triaged by perf sheriffs who create bugs and start bisect jobs to find the root cause of regressions.
Debugging memory regressions
If you are investigating a memory regression, chances are, a pinpoint job identified one of your CLs as a possible culprit.
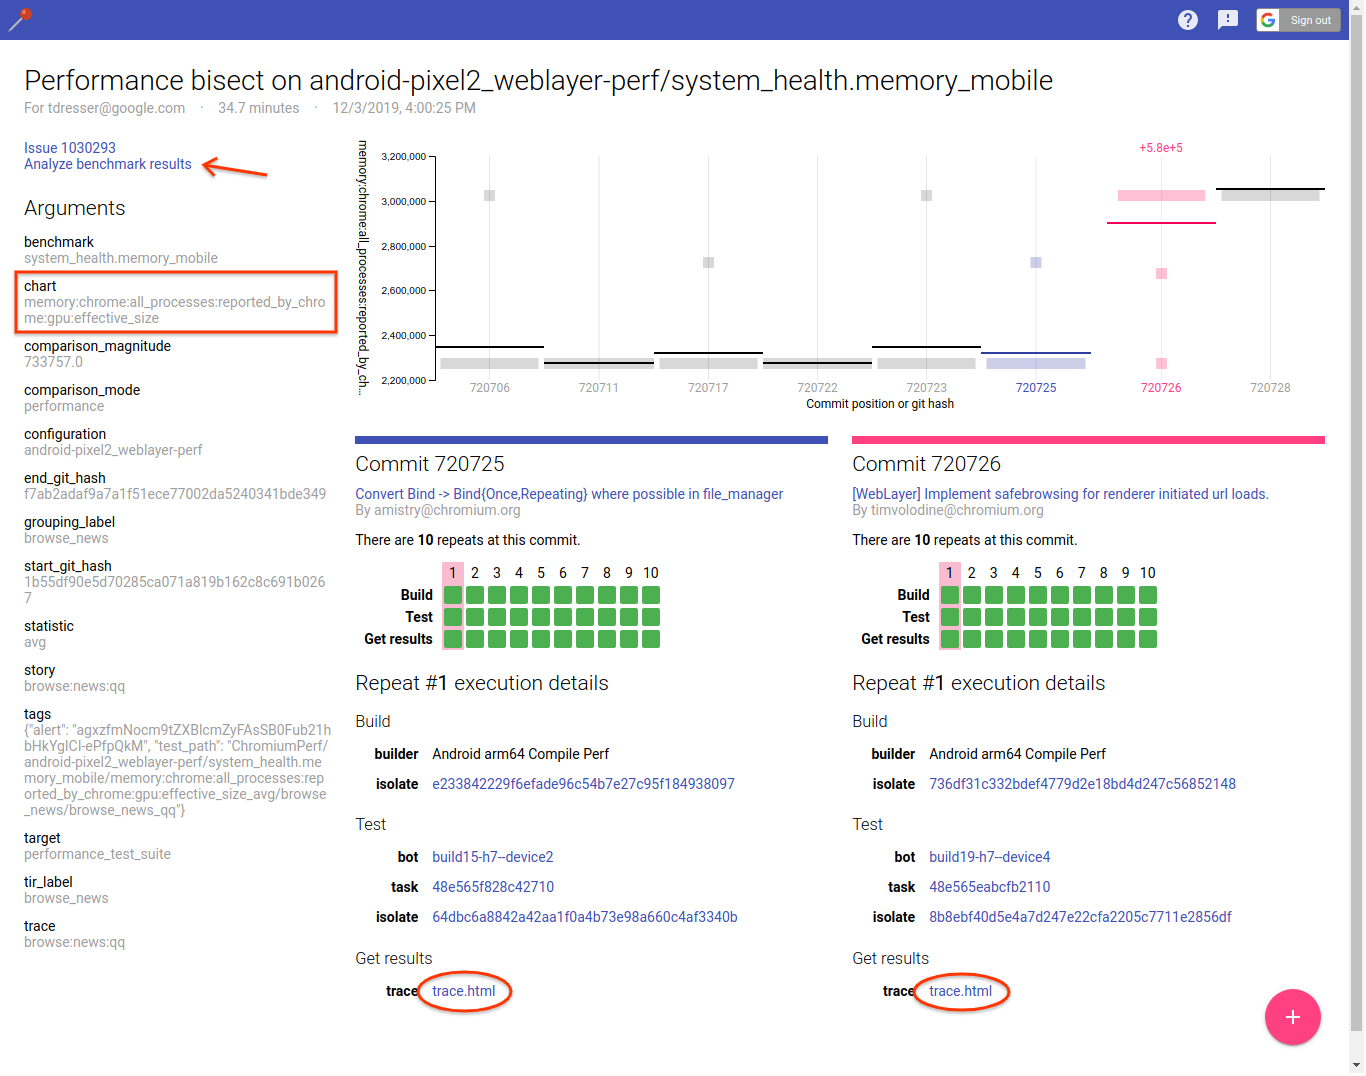
Note the “chart” argument identifies the memory metric that regressed. The pinpoint results page also gives you easy access to traces before and after your commit landed. It's useful to look at both and compare them to identify what changed. The documentation on memory-infra explains how to dig down into details and interpret memory measurements. Also note that pinpoint runs each commit multiple times, so you can access more traces by clicking on a different “repeat” of either commit.
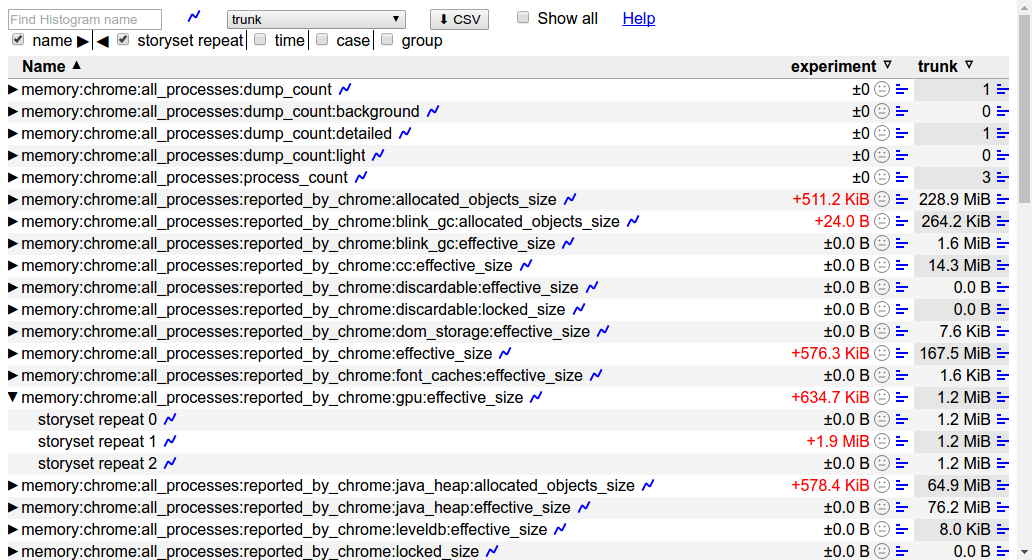
Sometimes it's also useful to follow the link to “Analyze benchmark results” which will bring up the Metrics Results UI to compare all measurements (not just the one caught by the alert) before and after your CL landed. Make sure to select the “before” commit as reference column, show absolute changes (i.e. “Δavg”) instead of relative, and sort by the column with changes on the “after” commit to visualize them more easily. This can be useful to find a more specific source of the regression, e.g. renderer_processes:reported_by_chrome:v8:heap:code_space:effective_size rather than just all_processes:reported_by_chrome:effective_size, and help you pin down the source of the regression.
To confirm whether a revert of your CL would fix the regression you can run a pinpoint try job with a patch containing the revert. Finally, do not close the bug even if you suspect that your CL may not be the cause of the regression; instead follow the more general guidance on how to address performance regressions. Bugs should only be closed if the regression has been fixed or justified.
How to run the benchmarks
Benchmarks may be run on a local platform/device or remotely on a pinpoint try job.
How to run a pinpoint try job
Given a patch already uploaded to code review, try jobs provide a convenient way to evaluate its memory implications on devices or platforms which may not be immediately available to developers.
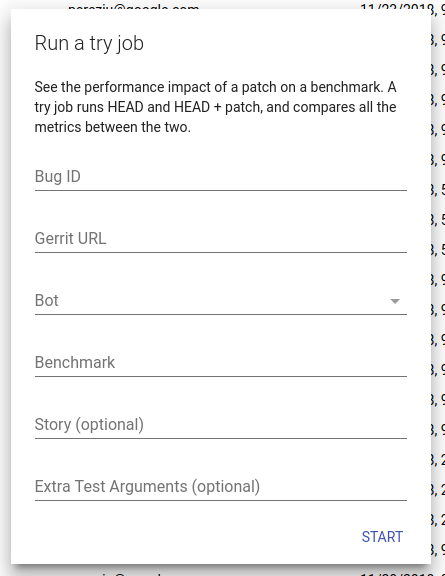
To start a try job go to the pinpoint website, click on the + button to create a new job, and fill in the required details:
- Bug ID (optional): The id of a crbug.com issue where pinpoint can post updates when the job finishes.
- Gerrit URL: URL to the patch you want to test. Note that your patch can live in chromium or any of its sub-repositories!
- Bot: Select a suitable device/platform from the drop-down menu on which to run your job.
- Benchmark: The name of the benchmark to run. If you are interested in memory try
system_health.memory_mobileorsystem_health.memory_desktopas appropriate. - Story (optional): A pattern (Python regular expression) passed to Telemetry's
--story-filteroption to only run stories that match the pattern. - Extra Test Arguments (optional): Additional command line arguments for Telemetry's
run_benchmark. Of note, if you are interested in running a small but representative sample of system health stories you can pass--story-tag-filter health_check.
If you have more specific needs, or need to automate the creation of jobs, you can also consider using pinpoint_cli.
How to run locally
After building, e.g. ChromePublic.apk, you can run a specific system health story with the command:
$SRC/tools/perf/run_benchmark run system_health.memory_mobile \
    --browser android-chromium --story-filter load:search:google
This will run the story with a default of 3 repetitions and produce a results.html file comparing results from this and any previous benchmark runs. In addition, you'll also get individual trace files for each story run by the benchmark. Note: by default only high level metrics are shown, you may need to tick the “Show all” check box in order to view some of the lower level memory metrics.
Other useful options for this command are:
--pageset-repeat [n]- override the default number of repetitions--reset-results- clear results from any previous benchmark runs in theresults.htmlfile.--results-label [label]- give meaningful names to your benchmark runs, this way it is easier to compare them.
For WebView make sure to replace the system WebView on your device and use --browser android-webview.
Understanding memory metrics
There is a large number of memory-infra metrics, breaking down usage attributed to different components and processes.
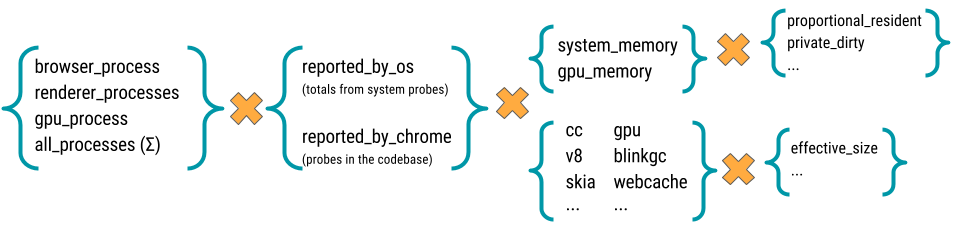
Most memory metrics have the form memory:{browser}:{processes}:{source}:{component}:{kind} where:
- browser: One of
chromeorwebview. - processess: One of
browser_process,renderer_processess,gpu_process, orall_processess. - source: One of
reported_by_chromeorreported_by_os - component: May be a Chrome component, e.g.
skiaorsqlite; details about a specific component, e.g.v8:heap; or a class of memory as seen by the OS, e.g.system_memory:native_heaporgpu_memory. If reported by chrome, the metrics are gathered byMemoryDumpProviders, probes placed in the specific components' codebase. For example, in “memory:chrome:all_processes:reported_by_chrome:net:effective_size_avg,” the component is “net” which is Chrome's network stack and “reported_by_chrome” means that this metric is gathered via probes in the network stack. - kind: The kind of memory being reported. For metrics reported by Chrome this usually is
effective_size(others arelocked_sizeandallocated_objects_size); for metrics by the OS this usually isproportional_resident_size(others arepeak_resident_sizeandprivate_dirty_size).
Read the memory-infra documentation for more details on them.